Data Collection
To get a brief overview of the data collected in the Events & Errors dashboard, watch this short video:
During a user session, SessionStack automatically collects the following data:
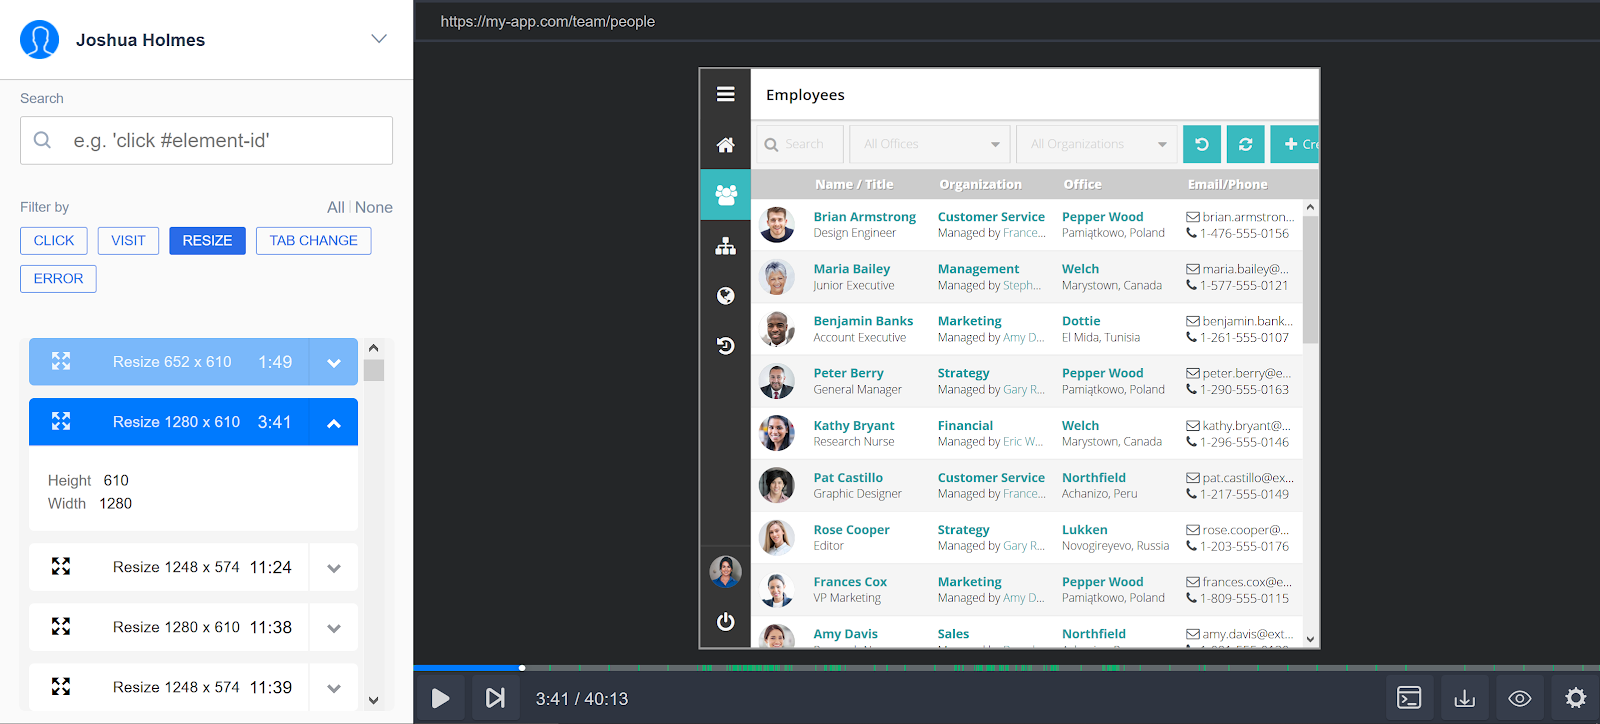
Browser window changes
SessionStack detects window resizing, as well as the scrollbar position, in order to pinpoint the exact place of the end-user at any given moment.
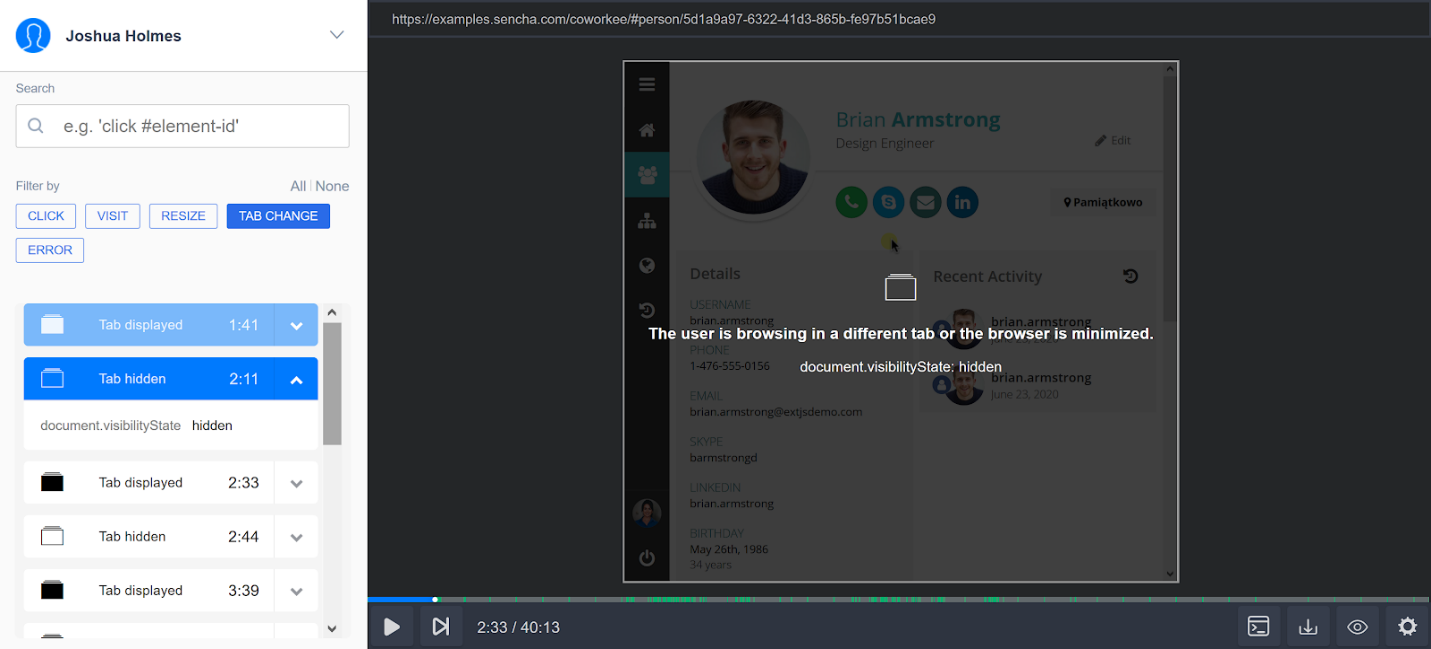
Changes In The Visibility State
SessionStack captures when the user starts browsing in a different tab or window and displays an overlay within the player viewer to let you know that the user is currently not active in your application.
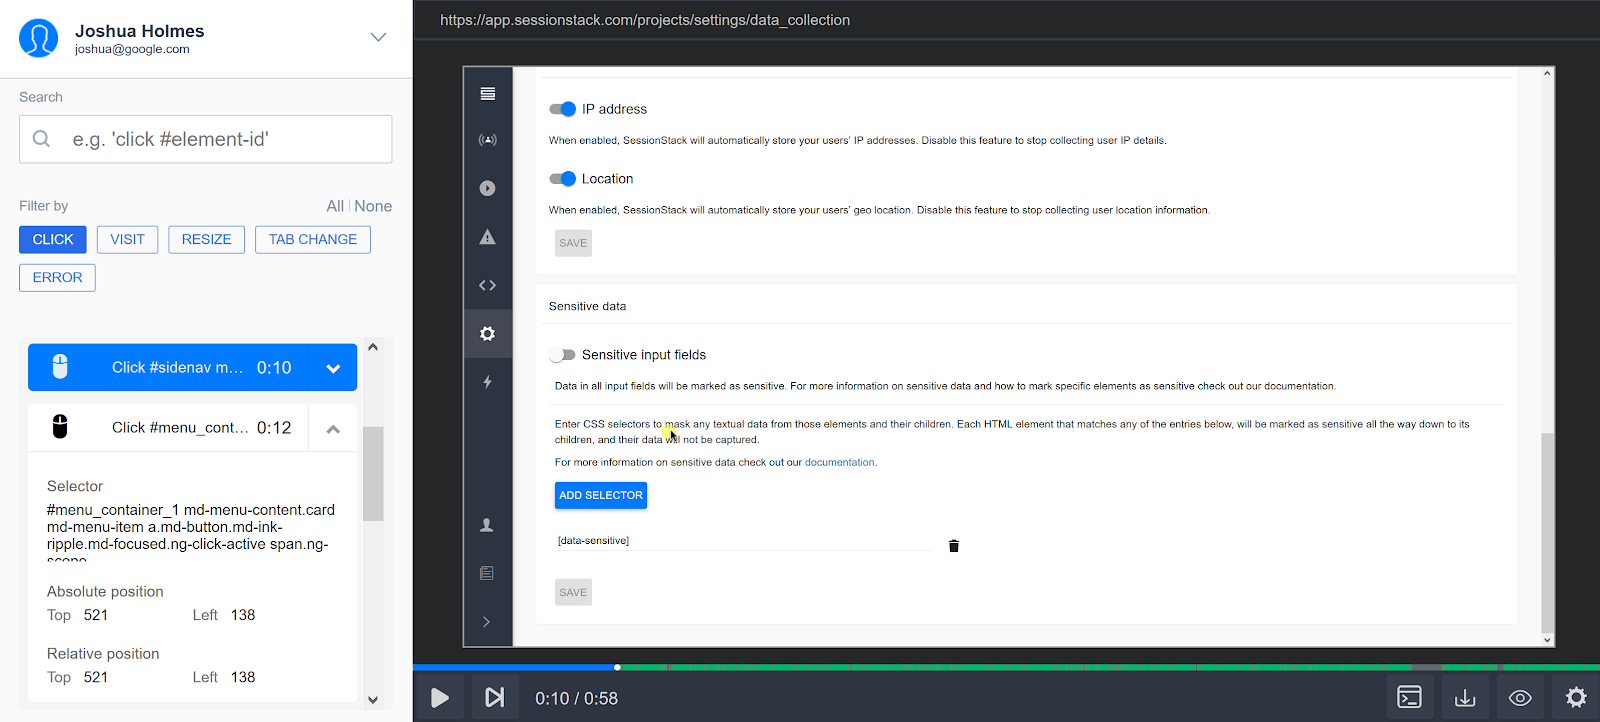
Mouse Events
Mouse events occur due to the user interacting with a pointing device. Common events include click, mouse up/down, etc. To show exactly what the user is doing with their cursor, SessionStack captures mouse move, click and hover events.
DOM Mutations
То recreate a pixel-perfect rendering of exactly what the user sees at any point in time, SessionStack captures all changes that take place in the browser DOM structure. This includes adding, moving, and removing nodes, changes to the element attributes, text changes in input and text area elements, as well as changes to the state of radio buttons, checkboxes, select, datalist and option elements.
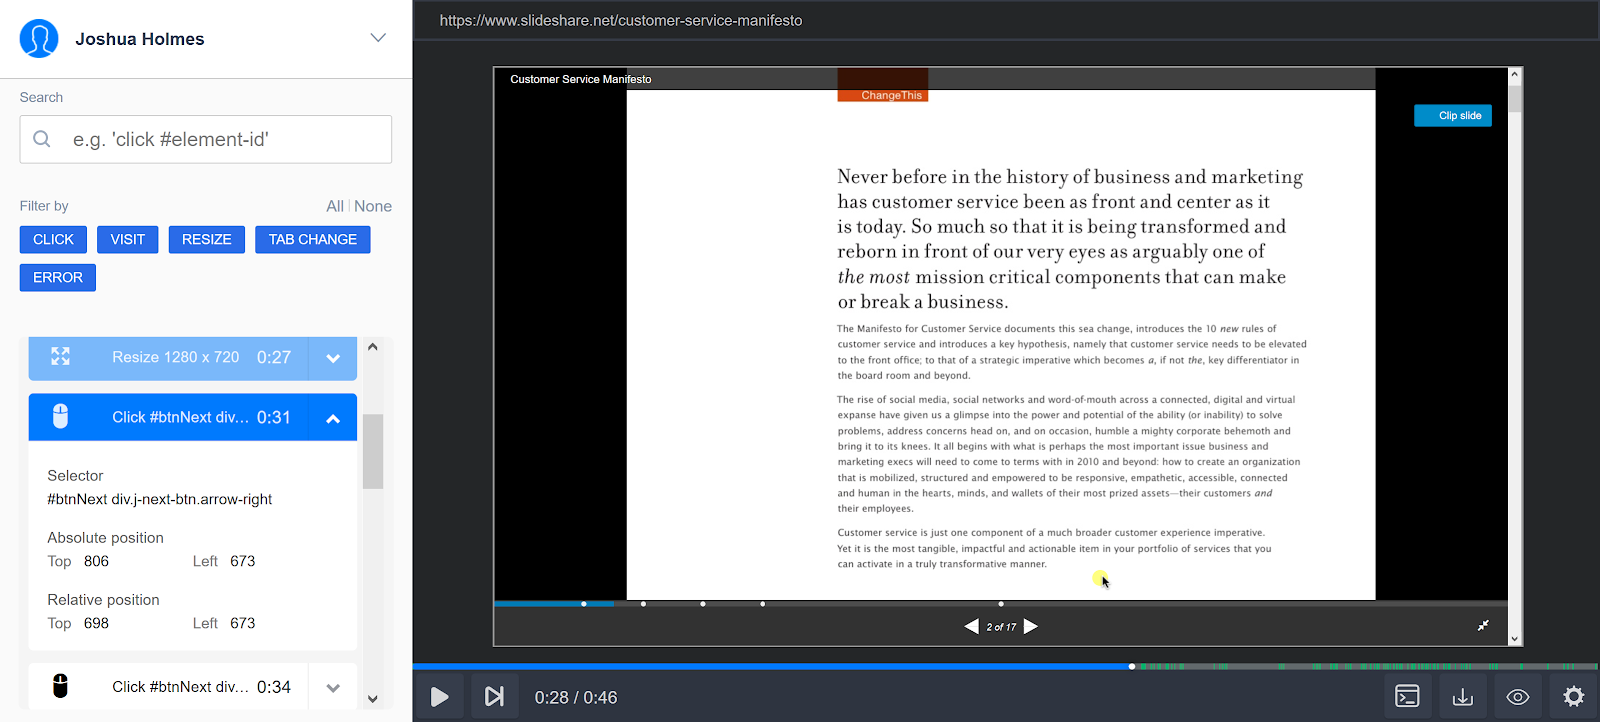
Expanding To Full Screen
Modern browsers allow for certain page elements to be expanded and viewed on the entire screen. A typical scenario for a user to expand your application to a full screen is when presentation mode is activated, or there’s an embedded video that can be watched full screen. SessionStack detects when an element is expanded to full screen to correctly simulate the user experience.
Capturing Static Resources
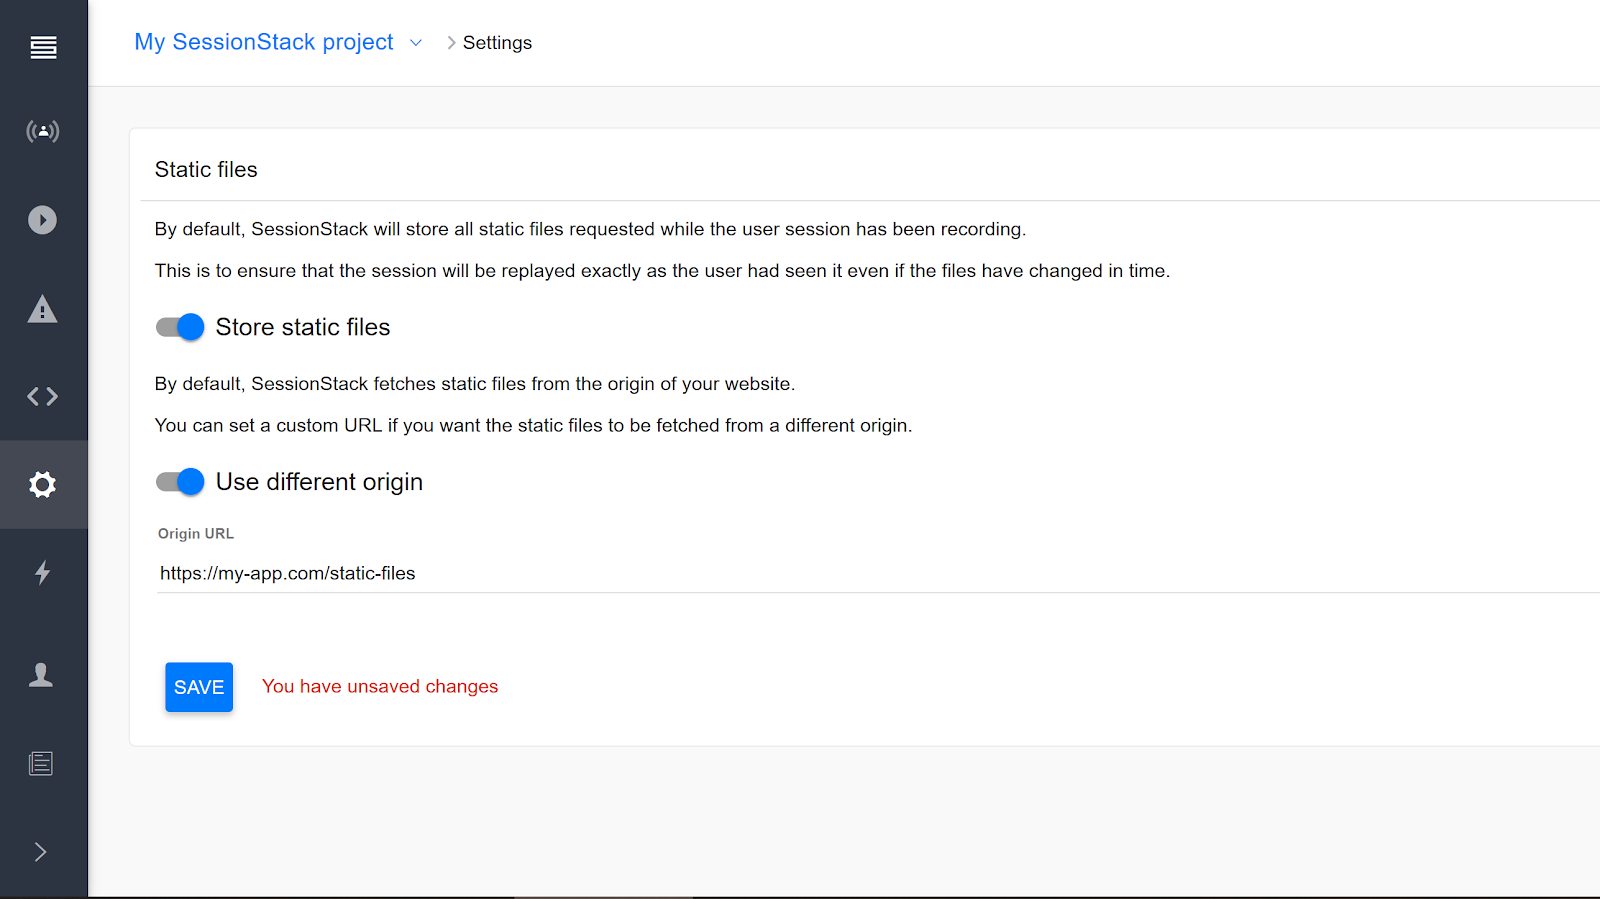
To be able to replay a recorded session even after the application’s static resources such as CSS, images, fonts, have been changed or deleted, SessionStack also captures a snapshot of all the resources that were part of the application at the time of recording the user session. Additionally, SessionStack records changes in the CSS of adopted stylesheets and changes made through insertRule/deleteRule.
By default, SessionStack will attempt to fetch those static files from the origin of your application. If you rather have SessionStack fetch the static files from a different origin, you can set a custom URL in your project settings section:
SessionStack can be configured to automatically monitor and log:
- Unhandled JavaScript Exceptions
- Network Requests and Responses
- Browser Console Calls
Unhandled JavaScript Exceptions
You can enable SessionStack to automatically log unhandled JavaScript exceptions with their corresponding stack traces.

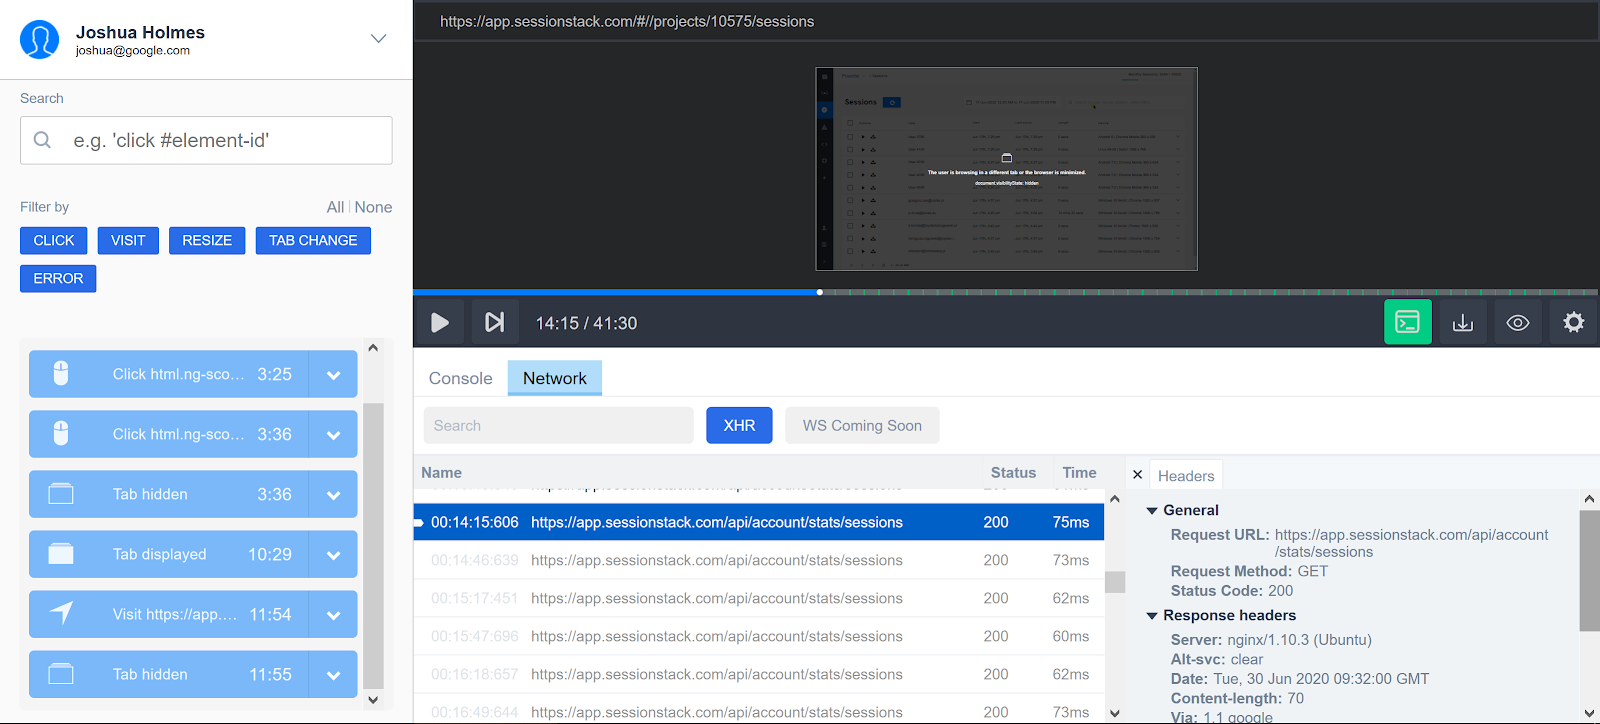
Network Requests and Responses
You can enable SessionStack to automatically log all or only failed network requests with their corresponding error messages. You can explore all XHR requests that happen during a user session, and analyze their details such as the URL, request method, status code, request/response headers, and so on.
Clicking the timing of each request will replay the session at that particular moment so that you can see what happened to the user in that period.
Browser Console Calls
You can enable SessionStack to automatically log all calls to the browser console. For example, if you enable the “Error” option, all calls to console.error will be automatically logged by SessionStack.

In essence, all logs (errors, warnings, debug and info messages, as well as network requests), can be found in the SessionStack browser console, along with their messages and stack traces. You can also see the error messages in the Steps Timeline from where you have a quick access button to the console to expand the entire stack trace.
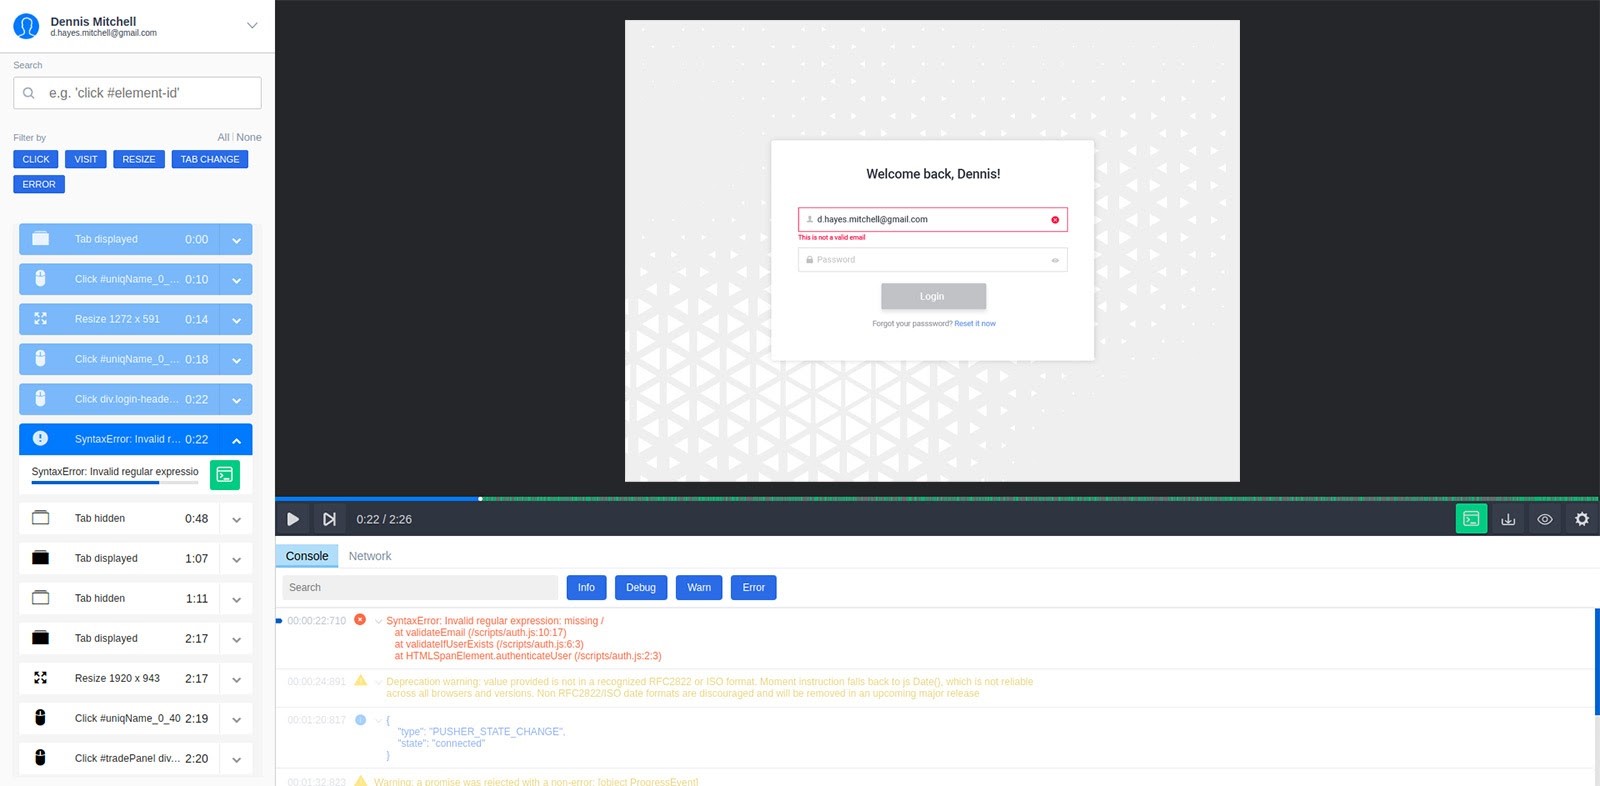
- Each log has a severity label (error, warning, debug, or info), a timestamp (up to the milliseconds in which it occurred in the user session), and the message it carries. If the log message is longer, it will offer the option to be expanded to display the stack trace or failed network request in an easy-to-review and copy format.
- All logs are searchable by their message.
- Filter logs by severity level: all types are selected by default. Click the buttons next to the search box to disable the ones you’d like to filter out.
- JSON and stack traces are formatted out of the box
- Easily navigate the console logs by clicking each log’s timestamp. Click the error message to expand it and copy/paste the stack trace. The moment you select the next log, the player will also jump to the moment in the recording when the error/warning/message was logged, and the timeline will fast forward to the step you are currently analyzing.
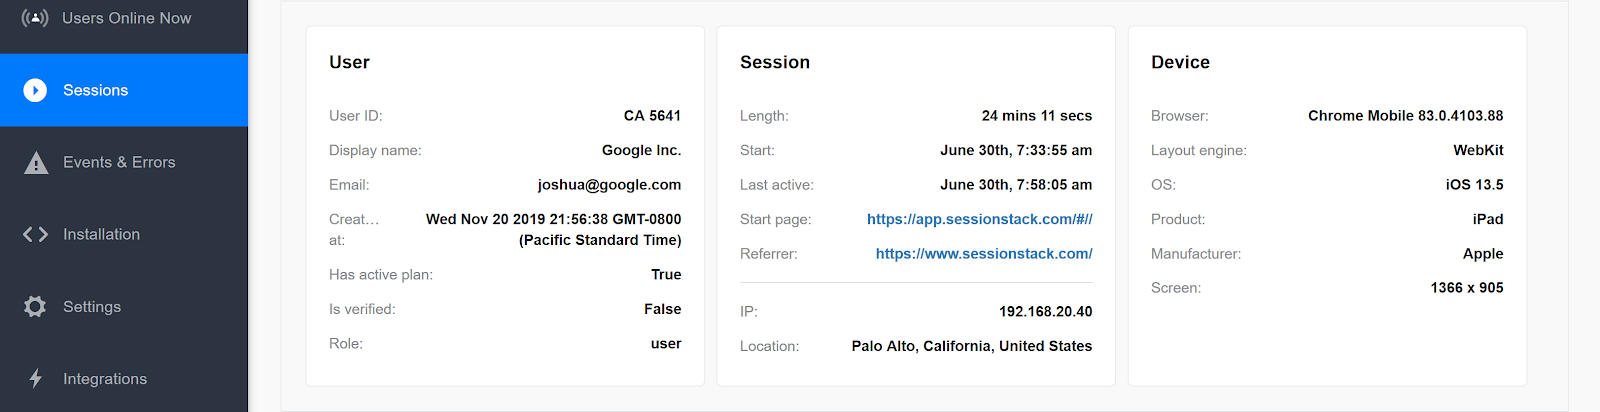
User Location
You can enable SessionStack to automatically capture the IP address and geolocation of your end-users, including city, state, and country.

Updated 4 months ago