Session Recording & Segments Dashboard
Once the SessionStack snippet has been installed, SessionStack will automatically start recording all your user sessions. See what’s a user session in SessionStack. All recorded sessions can be found in the Segments dashboard. In the users' list is shown the most recent session. All of the other recordings for any user from the grid can be found in the right-side panel by pressing the ">" sign.

Segments Dashboard
If you rather not record all your users’ sessions within your application, you can opt-out of automatic recording by disabling the option in your project settings >> recording:
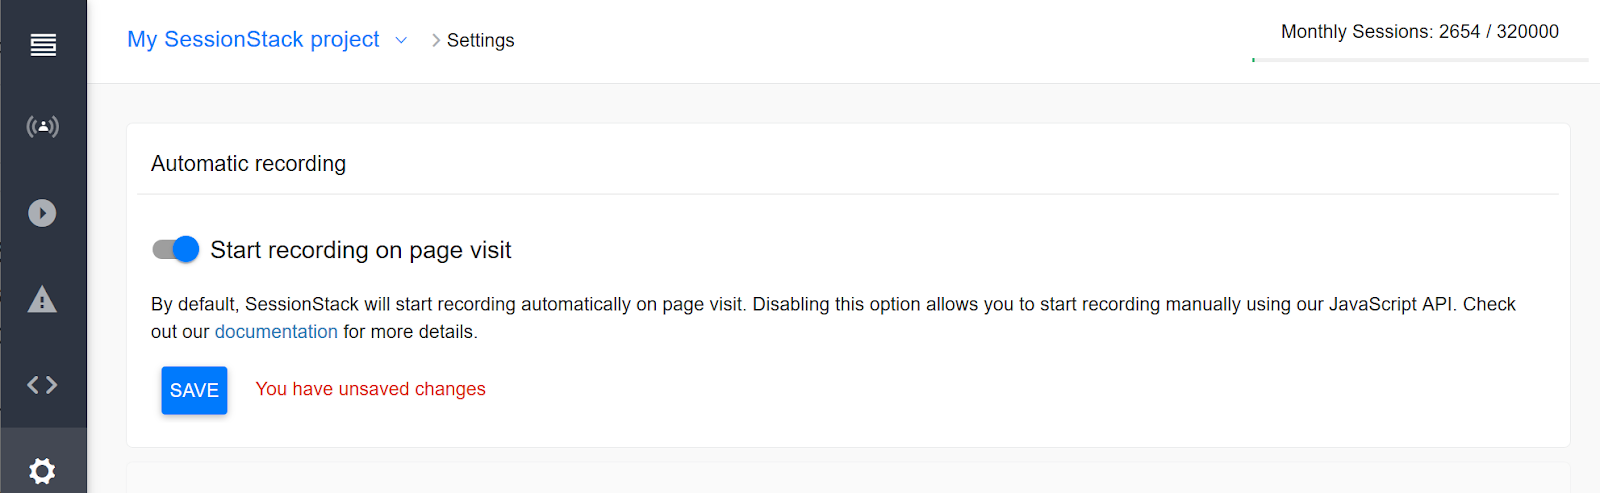
Note that if you choose to opt-out of automatic recording of user sessions, and you have not set up a manual recording for your web application, the only sessions that will be available for you to watch on-demand will be the ones you have watched live. Once you start a live session by hitting the Go live button, the latter will be recorded and will automatically appear in the Sessions dashboard when it ends. Also, bear in mind that these sessions count towards your monthly session quota. There is no option to watch live sessions without recording them.
You can manually set up SessionStack to record only selected pages and sections within your product by using our JavaScript API. Find out how.
Segments Dashboard
Our primary dashboard Segments contains 3 main parts.
You can watch this short video to get started:
I) Users' list: shows all users with at least one recorded session. The shown session in the users' grid is the most recent one. All user sessions can be found in the right side panel in descending order from most recent to the earliest as shown below.

Right Side Panel: User Sessions and User Details
Use the "Only matching sessions" toggle to list only the relevant sessions for filters if any applied. The option is disabled in case there are no applied segment filters.

"Only matching sessions" Option
Click on the "dots" for download and delete options. Check the image below.

Additional Options per each Session
Check the User Details by selecting the 2nd tab in the right side panel of the user

User Details
II) User Trends: 5 Charts: shown on the right next to the users' grid.
The first four charts of user trends provide you with a tool for determining how lively and strong your product is by answering the three essential questions:
- How many users currently meet the search criteria I have?
- How many sessions do the users have in the searched segment?
- How long do my users’ sessions usually last?
You can watch this short video to learn more about the Trends charts:
Description of User Trends
1) Users: The number of unique users who meet the filtering criteria
2) Total Sessions: total count of sessions across all users who meet the filtering criteria
3) Average Session Length: It is calculated by dividing total session time by the total number of sessions for users who meet the filtering criteria
4) Average Session Length per User: The sum of users' average session length divided by the number of users who meet the filtering criteria
User Trends are refreshed (reloaded) in one of the following cases:
- setting some search criteria, then all charts will be refreshed;
- choosing any of the previously created segments;
- switching between different previously created segments;
- clearing the applied filters or selected segment;
Description of Most Clicked Elements Chart
The fifth chart provides you with valuable information about the user's interactions. You can use this chart to understand which features of your product are the most used. This can be achieved in two single steps:
- define a segment of users by a combination of event filters such as Clicked Element and/or Visited URL and/or Custom Events. By using these filters you can easily define a feature in your product.
- check the "Most Clicked Elements" chart
- repeat step one and step two for each feature you want to investigate.

Most Clicked Elements chart
Each bar that is shown on the chart includes four main components:
- An HTML element that it has interacted with. If available for the element, the text is presented on the chart, too.
- The CSS selector of the HTML element is always shown.
- On page: displays the URL address of the page where the element is located. This will be useful if you have two buttons with the same text on them from different pages.
- Clicks and Users: count of the clicks and users who have clicked the element. These statistics can be visualized in both absolute values and percentages. Turn on the percentage option, as shown below, to see what percentage of your segment's users (or all users if no filtering criteria are used) are performing these clicks.
An even more useful feature of our new chart Most Clicked Elements is the ability to create a user segment quickly and easily. To do this, simply click the unique "Add Filter" icon for any row that you believe merits more examination. You may do this to see which users interacted with a particular element, to view their matching sessions, or to look at the remainder of the User trends for those users.
Check the image below for a better understanding.

Add Filter option
III) Filters Section

Filters Section - Filters List
Once the Segment filters are applied, the list of the users and charts are updated accordingly.

Filter Section - Configured Filter
The defined search criteria can be saved as a segment with a human-readable description so that each teammate understands what it is about without having to check the configurations thoroughly. The benefit of segment saving is that it can be used later by everyone in the team/organization. Next time, instead of creating a new configuration, simply select the previously saved one.

Saving Segment
Updated 4 months ago